3D MODELING FOR MULTIPATH EXPLOITATION RADAR
I highlight here some lessons learned simulating radar multipath in a simplified, but real, urban environment consisting of buildings, carports, vegetation, and vehicles. This effort was prompted by the assertion that an aerially mounted radar could survey a wide area of a city and detect and track vehicles of interest fleeing through the canyons of city buildings. This mission scenario is typically not attempted since no unambiguous radar contact from a moving vehicle is anticipated for this environment. Specifically, the radar return from a single vehicle would be composed of a multiplicity of returns coming from: 1) direct beam propagation, and, 2) multiple bounces, or echoes, from building sidewalls. So instead of detecting a single return signal in range/range-rate, the radar might see several (up to 3 or 4?) contacts at different ranges, most likely all going in different directions at different velocities!
Presumably this echo pattern is deterministic, deriving from: 1) the 3D geometric description of buildings, terrain, and vegetation, 2) their electromagnetic properties, and, 3) the instantaneous location of the radar. If this pattern could be calculated, it could be used to disambiguate the urban multipath radar environment.
A simplified 3D model of an actual urban area (33.424965N, 111.969603W) was constructed and animated with 3 SUV-like vehicles running in a racetrack pattern that conformed to a scripted radar experiment designed to gather real multipath data. The radar was mounted on a helicopter approximately 5 miles to the South East from the experiment site and moving slowly, generally in the South West direction. The experiment/simulation spans approximately 120 frames representing two minutes of data. Using custom written codes, a raytrace simulation was made to calculate the echo patterns for the experiment. While the urban model is reasonably simple, there are a lot of surprising ray paths to the vehicles. Some of those examples are shown below along with an animation of the complete range/range-rate simulation.
I only discuss the results of my simulation. An examination of the encouraging correlation to the actual radar returns is outside the scope of this memo.
Comparison of Real Urban Environment With 3D Model
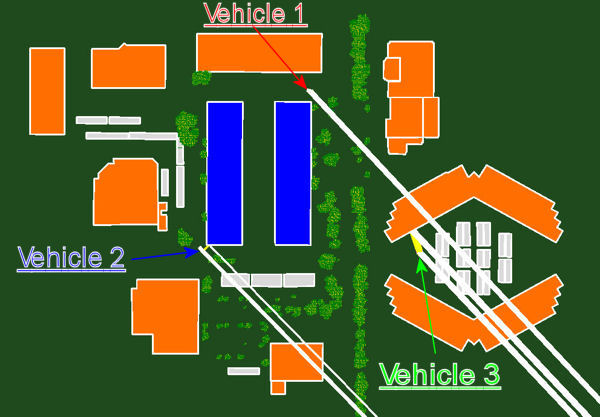
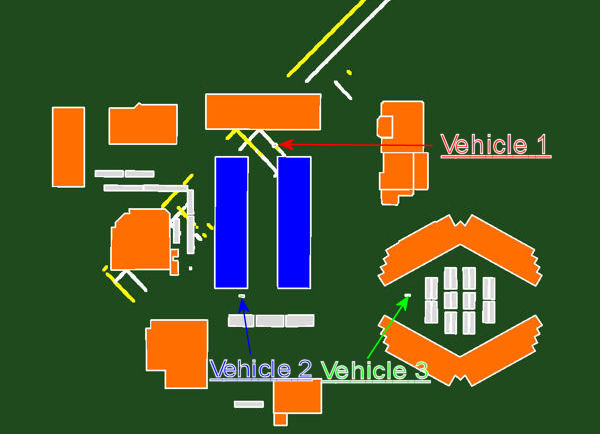
A satellite view of the area of study is shown in the left picture immediately below and the constructed 3D model is shown in the accompanying picture to the right.
The 3D model captured an accurate representation of the buildings, the vegetation, and 3 SUV-sized vehicles. The silver rectangles shown in the 3D overhead picture are carport roofs modeled as flat planes above the ground. It turns out these structures play an important role in the multipath signature of this area as will be demonstrated below. Inclusion of the vegetation representation also proved significant in our modeling. Two vehicles, Vehicle 1 and Vehicle 2, were animated to run over the instrumented courses notionally depicted in the left picture as the red and blue tracks, respectively. Vehicle 3 essentially remained fixed at its position, though there was some slight motion reported during the course of the radar experiment. Vehicles 1 and 2 were scripted to be approximately 180 degrees out of phase along their tracks. At all times only a single vehicle was between Buildings A and B.
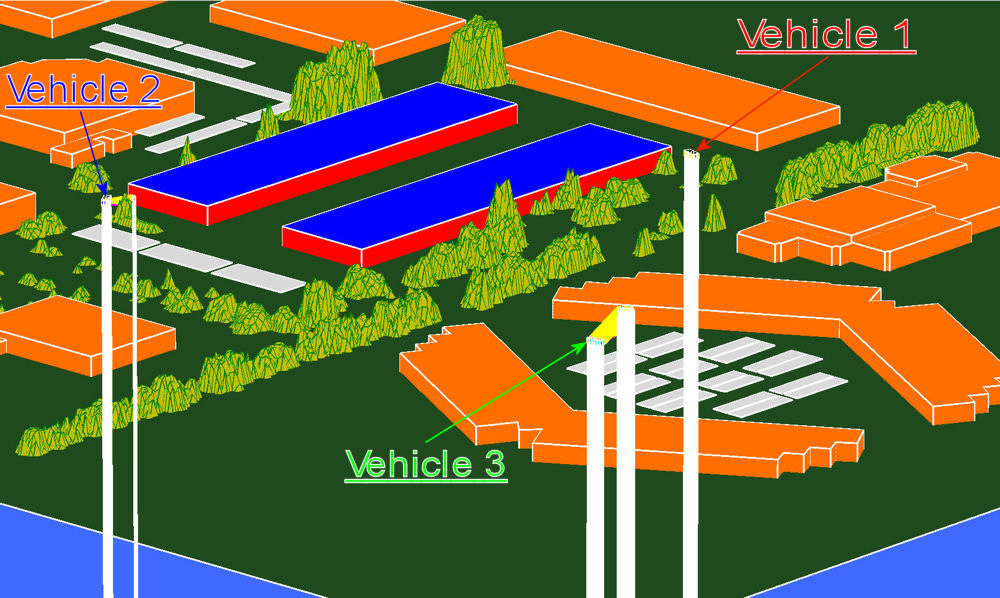
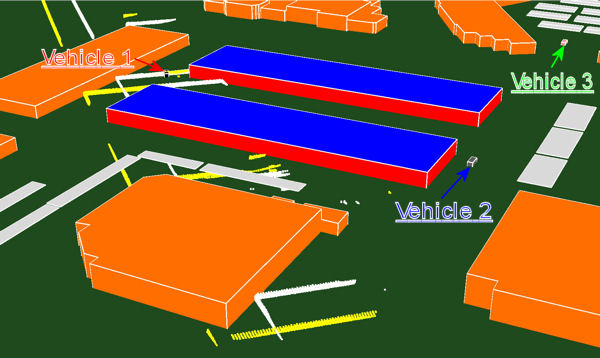
Without knowledge of the radar's beam pattern, straight line raytracing was done over the entire 2D support of the region. Rays from the moving radar platform were directed towards the ground at 1m sample positions and allowed to reflect up to four bounces. Only rays hitting a vehicle through direct line-of-sight or reflection from buildings were collected for analysis. All other rays were discarded for analysis and plotting. Ray reflection amplitudes were modeled as 100% reflective. The solid white beam bundles in the right-hand picture are comprised of individual rays too close together at this viewing distance for resolution. The picture at the right is just one frame from the sequence of 120 instances constituting the animation.
The 3D model was meant to capture the structures deemed important to demonstrate multipath path effects in this canyon environment. The lateral geometry for the buildings was derived from overhead aerial imagery even though a lidar 3D database was available digitized at 1 m lateral resolution. Lidar databases are 2.5 dimensional, convex-hull representations of a terrain and are not useful for modeling the reflections from vertical building sidewalls. The lidar database was useful, though, for providing the vertical heights of structures and the vegetation representation in this region.
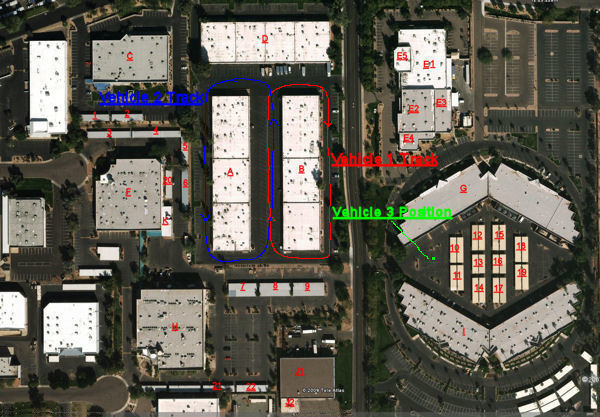 |
Satellite View of Study Area
Vehicles 1 and 2 approximate tracks between Buildings A and B
 |
Overhead View Of 3D Model
Showing MultiPath Rays To Vehicles
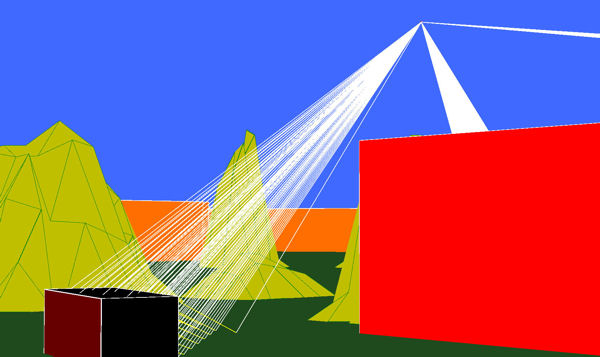
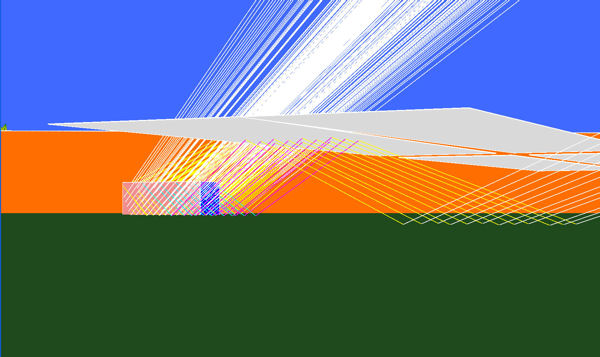
Perspective View Of 3D Model
The image in this panel is the perspective view of the 3D model shown before. Note how the vegetation is influencing the radar signature of Vehicle 2. The signatures for Vehicle 2 and Vehicle 3 have a contribution from a building sidewall. Also, Vehicle 3's signature has a multipath contribution from a carport as shown later.
 |
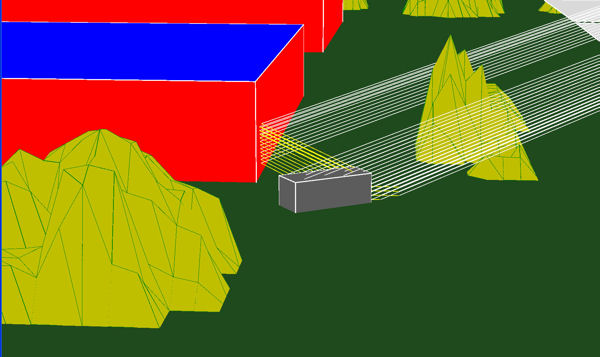
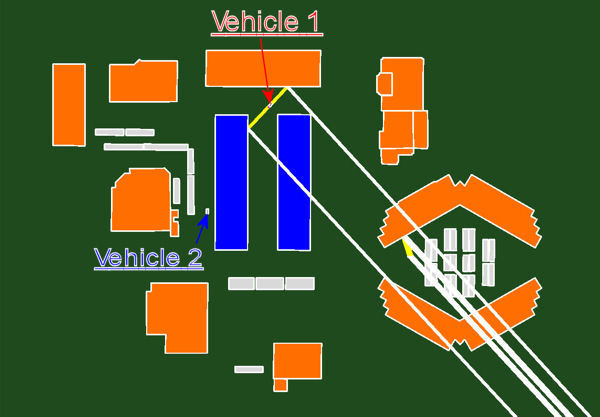
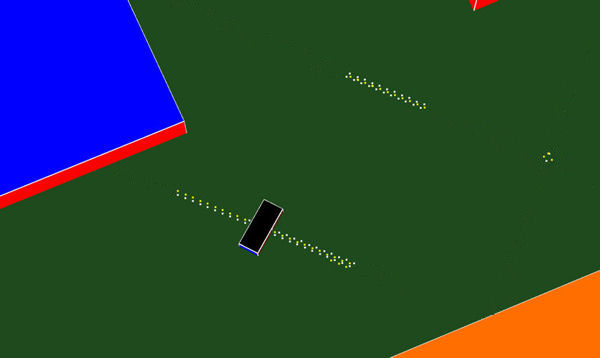
Closeup MultiPath Views To Vehicle 1
For our purposes, it was sufficient to model the vehicles as boxes with dimensions corresponding to a medium sized SUV. The multipath contribution only comes from the ground in this frame. Note that the rays are color coded as to bounce number. This is done to help in the visual interpretation of phenomenology more complex than would be first expected. White is reserved for direct line of sight; yellow connotes first bounce. In the picture at the right, the radar platform is seen at the origin of all the rays contributing to vehicle contacts for this frame.
 |
 |
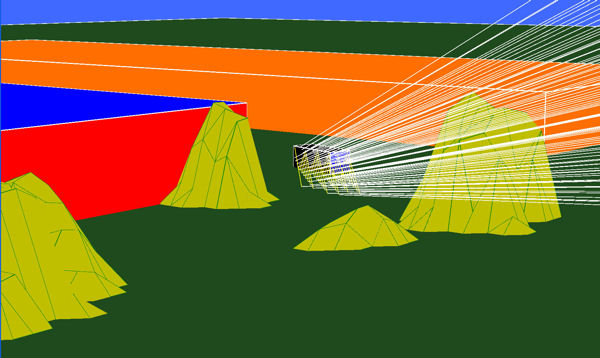
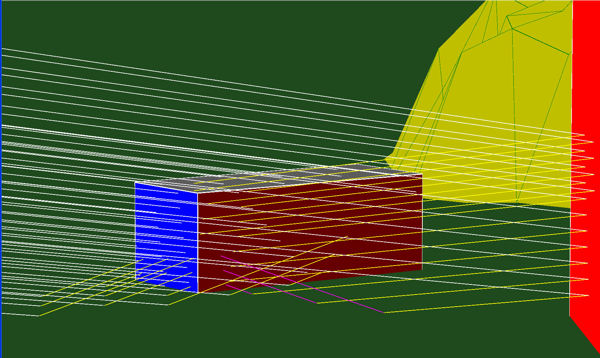
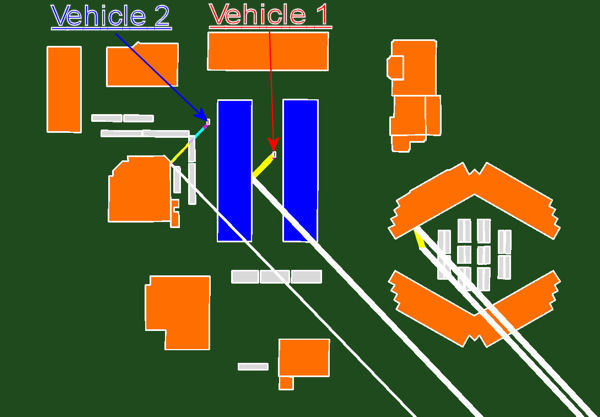
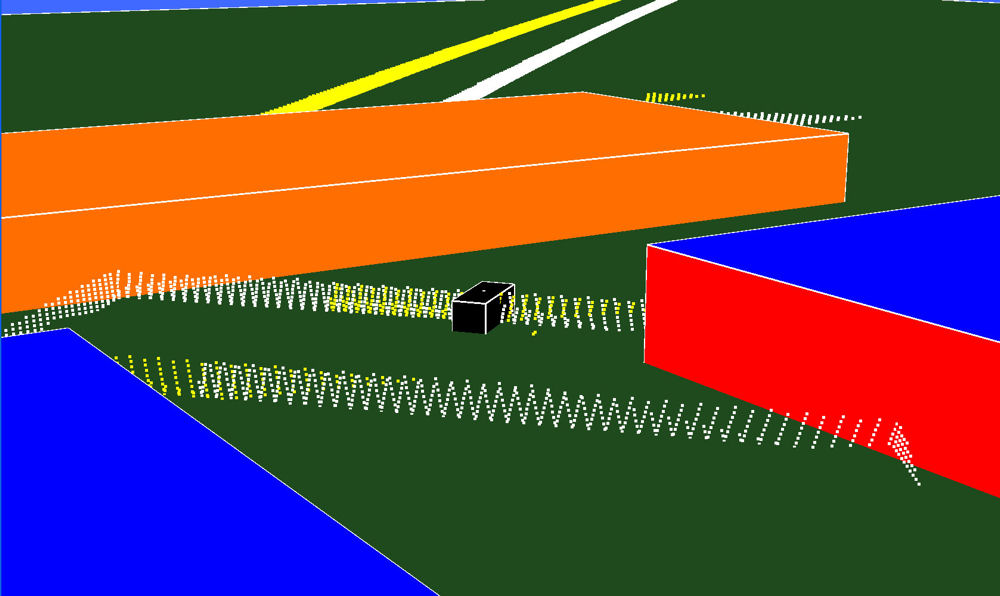
Closeup MultiPath Views To Vehicle 2
The raypaths to Vehicle 2 for this frame reveal the next level of complexity an urban environment poses to a radar detector. In the left picture we see direct line of sight rays and a first bounce ground path similar to Vehicle 1 above. But now there is also a building sidewall path to Vehicle 2. Notice also how the vegetation intercepts some of the rays that would reach Vehicle 2. In many situations in the simulation, the vegetation completely blocked any radar signal return.
The view on the right shows most of the sidewall reflected energy reaching the Vehicle after a second bounce from the ground. Also the vector dot product of these rays with the Vehicle's velocity vector has the opposite sign as the rays hitting the blue and gray surfaces. A plot of range/range-rate would show two contacts at slightly different ranges but going in opposite directions.
 |
 |
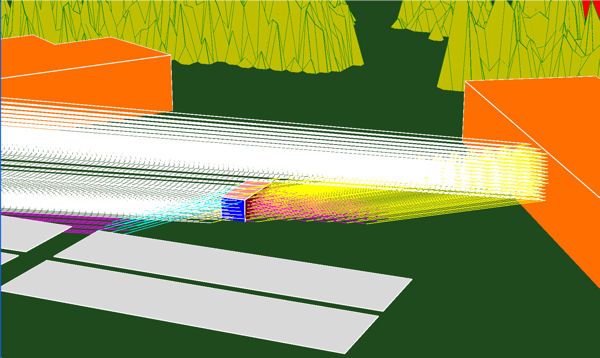
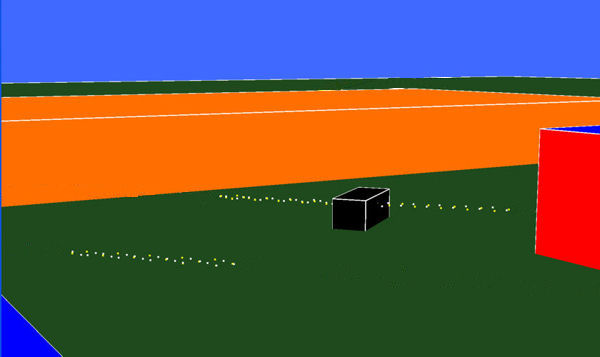
Closeup MultiPath Views To Vehicle 3
Though remaining essentially stationary during the simulation, the ray paths to this Vehicle are probably the most complicated of the three Vehicles for this frame time. Energy gets to the Vehicle via direct propagation, and single, double, and triple bounces. The triple bounce comes from a path that reflects from the underside of the carport roof, as seen in the right hand image. To follow this path, start with the white rays touching the right hand side of the picture. (The bounce-number color coding for zero, one, two, and three reflections is white, yellow, magenta, and cyan, respectively.)
 |
 |
Other MultiPath Examples
While the two pictures in this panel do not include the vegetation database, they are interesting for other purposes. The picture on the left is interesting because Vehicle 1 is illuminated co-linearly from the front and the back. This orientation serves as the example for the discussion of Radar Assisted Ray Tracing below. Vehicle 2 is shadowed by Building A in this frame, explaining why no rays are drawn to this position.
The picture on the right shows a four bounce path to Vehicle 2. Again, reflections under the carport roof explain this path way, justifying the inclusion of these structures in our 3D model. However, there is some kind of bush or tree at the corner of the carport which would severely attentuate or block this pathway. (See the right hand image in the first row 'Overhead View Of 3D Model Showing MultiPath Rays To Vehicles.') So again, inclusion of the vegetation database is a justified exercise constructing realistic databases for multipath exploitation radar programs.
 |
 |
Movie of Multipath Experiment Simulation
The movie in this panel is the result of my modeling efforts showing the echo patterns for our 3D urban database model for the approximate two minute, 120 frame sequence for the scripted three vehicle experiment. Vehicle 1 made three complete circuits around Building B and Vehicle 2 made approximately 2.75 circuits around Building A in this time. The color coded diamond symbols are the computed range/range-rate multipath signatures for this environment. The large circles are the actual range/range-rates for the vehicles whether shadowed by buildings and vegetation, or not. In a perfect world with no clutter and noise, a radar screen would only display the diamond symbols. And computer processing would take this multiplicity of diamond symbols and generate the "truth," viz. the circles representing the true, single, instantaneous position and velocity of the vehicles.
The diamond symbols for a particular Vehicle disappear when that vehicle is completely shadowed, having no direct or multipath ray path. And the slight motion of Vehicle 3 is dominated by the platform motion of the radar itself.
 |
MultiPath Radar Signature
Radar Assisted Ray Tracing
(RART)
While the above discussion exquistely exposes the multipath phenomenology, echogram plots have no utility in the multpath exploitation radar signal processing chain. What is really asked of this model based processing step is: given a radar return corrupted by a multiplicity of apparent contacts, what are the unambiguous, single point target positions giving rise to this signature? Posed this way, multipath exploitation radar signal processing is seen as a form of inverse problem.
My suggestion for a solution to this problem is really quite simple and makes use of the best ray tracer known to mankind: the radar itself. The idea is to use the reported range values of all current contacts and trace rays of only that length within the antenna beam pattern against the urban 3D model. I call this technique radar assited ray tracing (RART.)
The following two pictures illustrate this idea and motivate some of the steps that will be necessary to implement RART. To keep the plots simple, only Vehicle 1 is considered. This frame is interesting because Vehicle 1 is co-linearly illuminated from the front and back due to building multipath. But in general RART does not rely on this stressing multipath example.
Using my simulated radar (echogram) as described above, I know that the two ranges to Vehicle 1 are 8075.725m and 8090.0m. Only the tips of the rays with these lengths are plotted in the two pictures in this panel. The 8075.725m tips are color coded white; the 8090.0m tips are color coded yellow. Finally, only those tips within 2.0m of the ground are shown. What remains are those portions of two spheres of radius 8075.725m and 8090.0m as they are folded by the 3D geometry of the urban database. (In the world of Synthetic Radar Aperture, these points are related to the phenomenon of layover, but in three dimensions.) All of these point COULD be the location of one or two vehicles or many vehicles. If we assume there is only one vehicle generating these two reported ranges, we must (and can) filter this number of points to a smaller subset.
 |
 |
The picture in this panel focuses on the actual source of the double echo pattern and immediately suggests the first step in culling the number of position hypotheses. If a single position is the source of two ranges to target, then those RART traced tips must be within some specified distance of each other. Looking at this picture, many points can be excluded. However, because of the special circumstance for this frame where the multipath rays are co-linear, there still remains a large number of positions that could give rise to the current echogram. However, where the multipath rays typically cross at angles away from multiples of 180 degrees, the spatial hypotheses can be culled to a minimal number of locations.
 |
In this panel we see the results of restricting the position hypotheses by co-location of range tips and consideration of points approximately 1m above the ground (and above a categorized road, potentially.) Again, the finite number of positions is a result of the rare co-linear orientation of the multipath rays. However, a final exclusion of the extraneous location hypotesizes could be made by forming tracks for each location. Those tracks that are not real will quickly die off and need not be tracked further.
 |
 |
Discussion
Much has been accomplished; much needs to be investigated.
The first question that needs answering is: what level of detail is necessary to describe the 3D urban database. The answer in part will be mediated by balancing the accuracy of the calculated radar signature versus the computer complexity in terms of computational times and storage. Obviously, the most direct way to approach this question is to correlate calculations with actual data for a known environment. Several modeling questions that need to be addressed are: 1) what is the importance of windows, door ways, ledges, etc., 2) do sidewall reflectance amplitudes need to be more realistically modeled, and 3) should returns from vegetation (clutter) be included.
And the question must be raised how well the multipath exploitation hypothesis will work for realistic urban environments. The model examined here was carefully constructed so that only one vehicle was present between the buildings at a single time. What are the issues when many vehicles are traveling closely in the same canyon area. Will the multipath exploitation platform be constrained to operate only in the late evening/early morning? And a related question is: what is the result of using an incorrect 3D model. For example, using RART (and any other approach) with a 3D urban model with no vehciles in the roadways will conceivably generate patterns that do not correlate well with surveillance data when delivery trucks and tanks are moving in the roads and intersections.
Finally, the use of RART lends itself to real time computational rates. Software should be written with multiprocessor architectures and GPUs as the platform of choice.
I'd be happy to hear your thoughts and questions.
Author:Dennis M Hancock